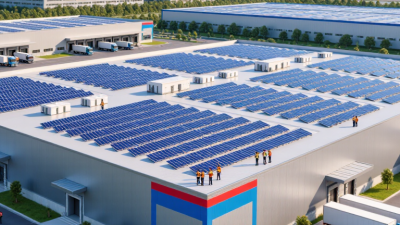
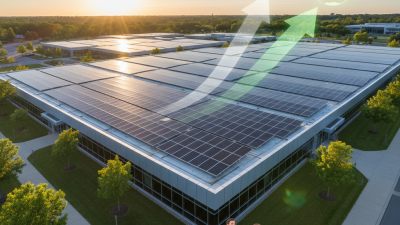
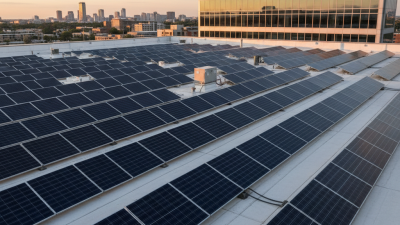
Choosing the right solar panel for business in 2026 is less about chasing a record efficiency figure. Your roof, operating hours, electricity rates, and expansion plans matter just as much. A warehouse with broad, unshaded roofing has different needs from a shop with limited roof space. Small details matter. An extra few percentage points of module efficiency may help where space is tight, but can raise project costs. That trade-off deserves a spreadsheet, not a sales slogan.
In 2020, International Energy Agency Executive Director Fatih Birol described solar PV as “the cheapest electricity in history.” That statement reflects solar’s falling-cost momentum, not a guarantee that every commercial installation will pay back quickly. For a business, the final economics depend on equipment, installation, financing, local sunlight, and how much power the site uses while panels are producing. A panel’s laboratory rating cannot tell the whole story.
This guide compares key options through practical questions: How much usable roof space is available? Does the system’s output match daytime demand? What do the product warranty, performance warranty, and degradation figures actually cover? Check datasheets alongside installer proposals, and compare assumptions such as shading, annual energy production, and maintenance. No comparison is perfectly clean. Quotes may use different forecasts, and the highest-rated module may not suit your building or budget. The right solar panel for business is the one that fits the site, meets documented performance needs, and makes sense under realistic—not idealized—assumptions.
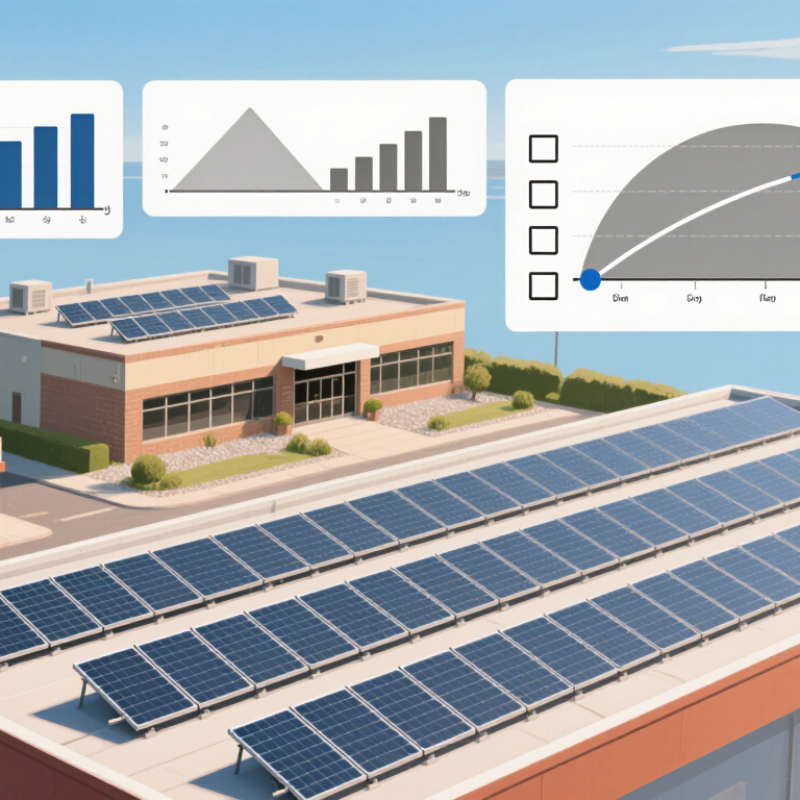
In 2024, solar accounted for 64% of new U.S. electricity-generating capacity, according to the Solar Energy Industries Association. That is a striking share. It describes new capacity added, not the share of all electricity generated by solar. That distinction matters. For businesses, the figure shows how quickly solar is expanding, but it does not identify the right system for any particular building.
Start with the site’s actual electricity use. Compare utility bills across seasons, and note when equipment, refrigeration, or air conditioning runs. A warehouse with strong daytime demand may use more rooftop solar directly than a facility that operates mostly at night. Check roof age, shading, available space, and structural condition before comparing panel options. Numbers can mislead. A large system may look attractive, yet produce less value if much of its output arrives when the business needs little power. Local rates, export rules, and connection timelines also affect the economics, so confirm them with the utility and a qualified installer. Capacity statistics are useful context, not a purchasing plan; I would be cautious about treating one national growth figure as a site-level forecast.
Commercial buyers should compare panel efficiency with usable roof area, not treat it as a stand-alone measure of value. A higher-efficiency panel can produce more power from a crowded roof, but its rating does not predict how quickly output will fade. Check the module’s rated efficiency, temperature coefficient, and warranty terms together. Small differences matter when a warehouse roof has limited space.
NREL’s 2013 review, “Photovoltaic Degradation Rates—An Analytical Review,” examined nearly 2,000 reported rates and found a median degradation rate of about 0.5% per year. At that pace, a system would retain roughly 88% of its initial output after 25 years, before accounting for site-specific conditions. That is a useful planning benchmark, not a promise. Dust, heat, shade, and maintenance can shift real-world results. The median also hides variation between installations. A panel’s clean datasheet may look reassuring; a hot roof and neglected debris are less tidy. Compare long-term field evidence where available, and model annual production using local weather and roof conditions rather than efficiency alone.
Commercial roofs rarely offer a clean, uninterrupted rectangle. Vents, skylights, drains, and service paths can shrink the usable area quickly. Measure those clear zones and check roof capacity before comparing module efficiency. It is unglamorous work. It matters.
TOPCon modules can suit projects balancing output, cost, and straightforward procurement. Their actual yield still depends on the product’s temperature behavior, layout, and local conditions. HJT modules may be worth evaluating where heat is a concern; compare temperature coefficients on current datasheets rather than relying on broad claims. Back-contact modules keep electrical contacts off the front surface, which can help use limited roof space efficiently. Yet their price and installation details need close review. Not always a win.
On a crowded roof, shade from a vent can affect a small group of modules, so map obstructions throughout the day. Ask the installer to model string layouts and check access around equipment. Also confirm module dimensions, mounting compatibility, and wind-load assumptions with the project engineer. I would not choose a technology from a single efficiency number. The best fit may change after a structural review—or after the first accurate roof survey.
2026 Best Solar Panels for Business: Which One Is Right?
Compare lifetime value, not just nameplate watts. Start with a site-specific energy estimate, then model each year’s output over 25 years. NREL’s PVWatts documentation uses 14% as a default system-loss assumption, while its model also accounts for temperature effects. Hot rooftop conditions matter: use each panel’s temperature coefficient and local weather, rather than assuming laboratory output holds at noon in July. NREL’s degradation-rate review reports a median near 0.5% annually. At that rate, a 100-kW system producing 140,000 kWh in year one would generate roughly 3.3 million kWh over 25 years, before additional site-specific losses. This is an illustration, not a forecast.
Tips: Compare installed quotes against modeled lifetime kilowatt-hours. Include mounting, wiring, inverters, maintenance, and financing assumptions. Keep incentives separate so comparisons stay clear. Small changes matter.
A spreadsheet can divide installed cost by lifetime energy, then add electricity-price escalation or discounting for a fuller business case. But don’t let one tidy number make the decision. Shading, roof repairs, downtime, and actual operating temperatures can shift results. PVWatts’ default losses are a starting point, not a guarantee. Ask installers to show the assumptions behind their production estimate, and test a lower-output scenario. The model will still be imperfect; at least its weak spots are visible.
Modeled 25-year lifetime value per installed kW, accounting for temperature losses, degradation, and installed cost.
How to read this: In this illustrative commercial scenario, each option is modeled per 1 kW DC installed. The estimate assumes 1,500 kWh/kW of annual output before temperature losses, electricity valued at $0.12/kWh, and undiscounted output over 25 years. Temperature loss assumptions are 7% for conventional mono PERC, 6% for TOPCon, and 5% for HJT; assumed annual degradation is 0.50%, 0.40%, and 0.35%, respectively. Net value is lifetime electricity value minus the assumed installed cost. These are scenario inputs—not quotes or guaranteed results—and exclude financing, maintenance, incentives, taxes, and the time value of money. Actual performance and costs vary by site and project.
Match a 2026 Panel to Your Site, Utility Tariff, and Verified Installer Yield
A business panel choice should begin with the roof, not a wattage leaderboard. Measure usable area, shading, roof load, and the spacing around vents and access paths. High-efficiency modules can help when space is tight; on a broad roof, installed cost and expected output may matter. Small details count.
Then model the site against its actual utility tariff. Compare when electricity is used, demand charges, time-of-use rates, and payment for exported power. NREL’s PVWatts documentation applies a 14% default system-loss assumption, but that is only a starting point. Ask the installer to itemize shading, wiring, soiling, temperature, and downtime assumptions. A glossy annual-kilowatt-hour estimate is not enough.
Request a production forecast built from a site survey and local weather data, then compare it with independently checked projects of similar size and roof conditions. Check module dimensions, temperature behavior, warranty terms, and service access—not just peak output. NREL’s review of nearly 2,000 photovoltaic degradation rates found a median near 0.5% per year. That is a useful benchmark, not a promise for your roof. I would question any forecast that cannot explain its losses. Even a careful estimate can miss a future tree shadow or a changing work schedule.